
Your sidewalk data,
live in ArcGIS
DeepWalk Drive connects your sidewalk assessment data to ArcGIS through a live, two-way feature service. Updates in either system are reflected in the other automatically, with no exports, shapefiles, or re-uploads. When DeepWalk finishes a block, it's already on your map.
See your sidewalks in ArcGIS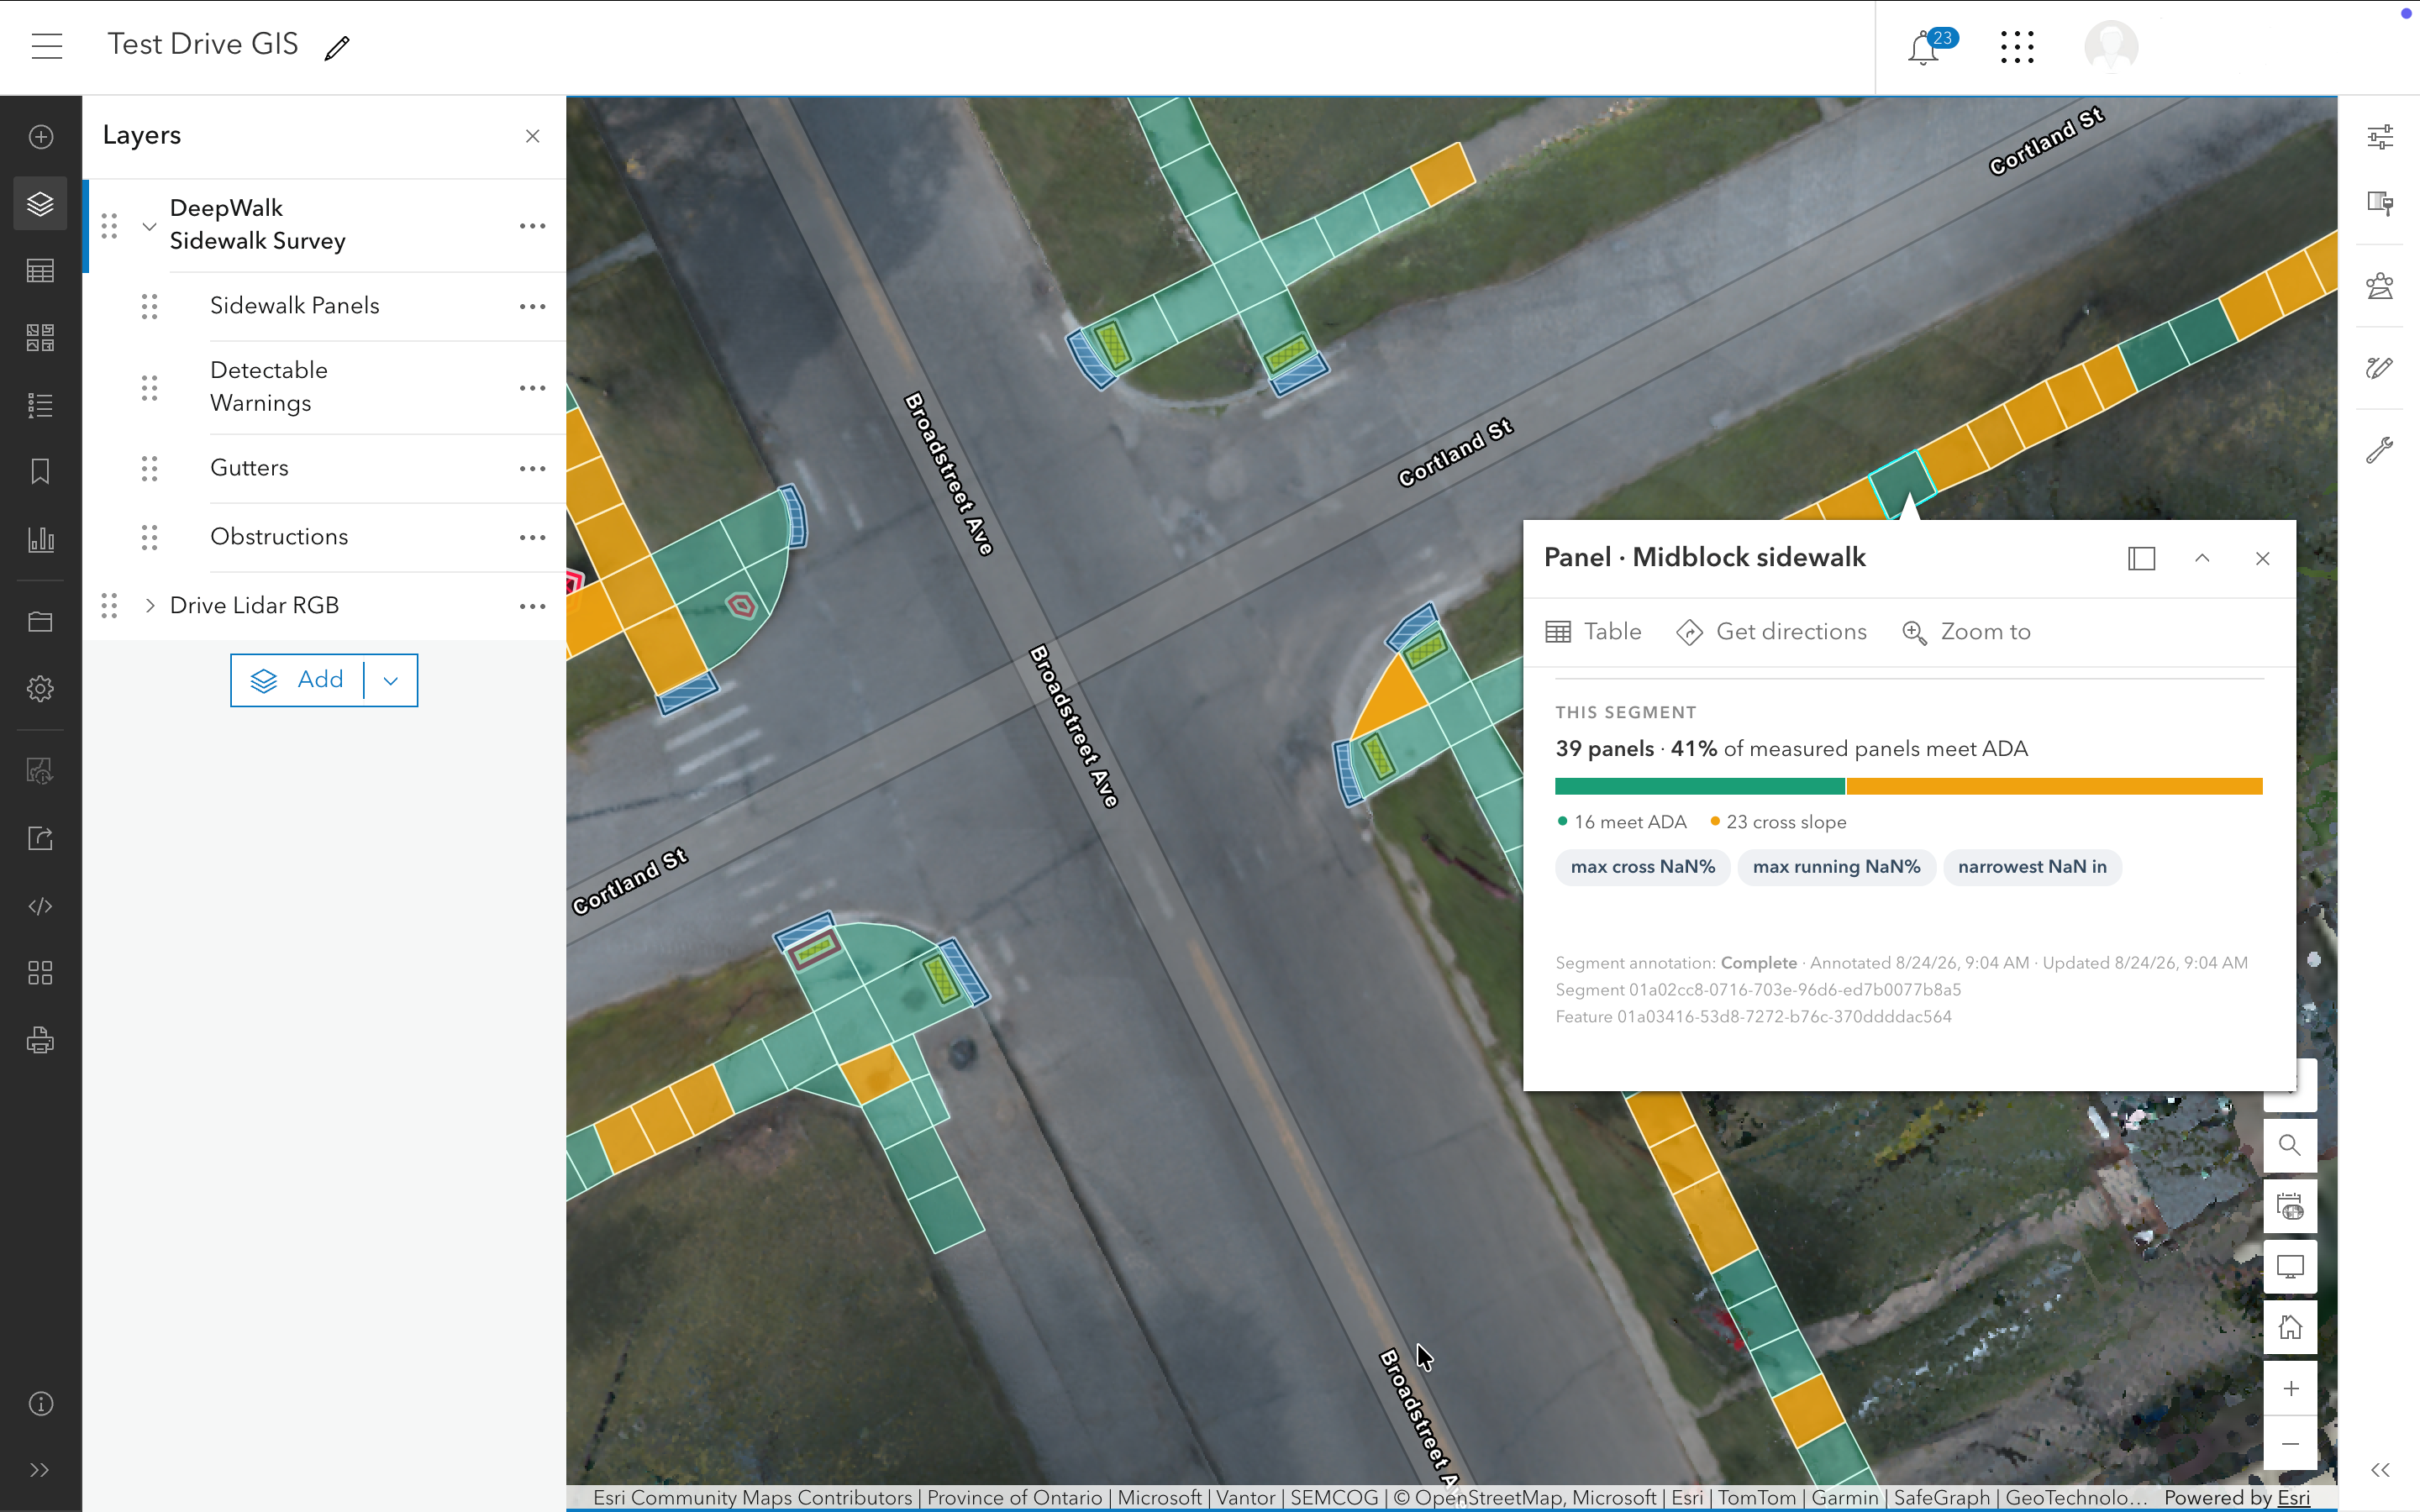
Always a live map of the current status of your assessment
Most assessments deliver a file, requiring GIS teams to import, style, and publish it again every time there is an update. DeepWalk works differently by updating ArcGIS and our web app at the same time.

Always current
Each time your map or dashboard draws, it queries DeepWalk directly. Your map always shows the latest, not last month's export.
Watch progress as it happens
Every segment carries an annotation status. Panels show up on your map as DeepWalk's reviewers finish them, so you can track assessments street by street.
Timestamped down to the panel
Every feature records the time it was annotated and when it was last updated, so you always know how recent each panel's data is.
Connect once
Add the service to a web map one time. Your maps, apps, and dashboards keep up as new streets are scanned and reviewed.
One source of truth
Your web map, capital-planning dashboard and engineers' desktops all read the same live service, so the numbers match everywhere.
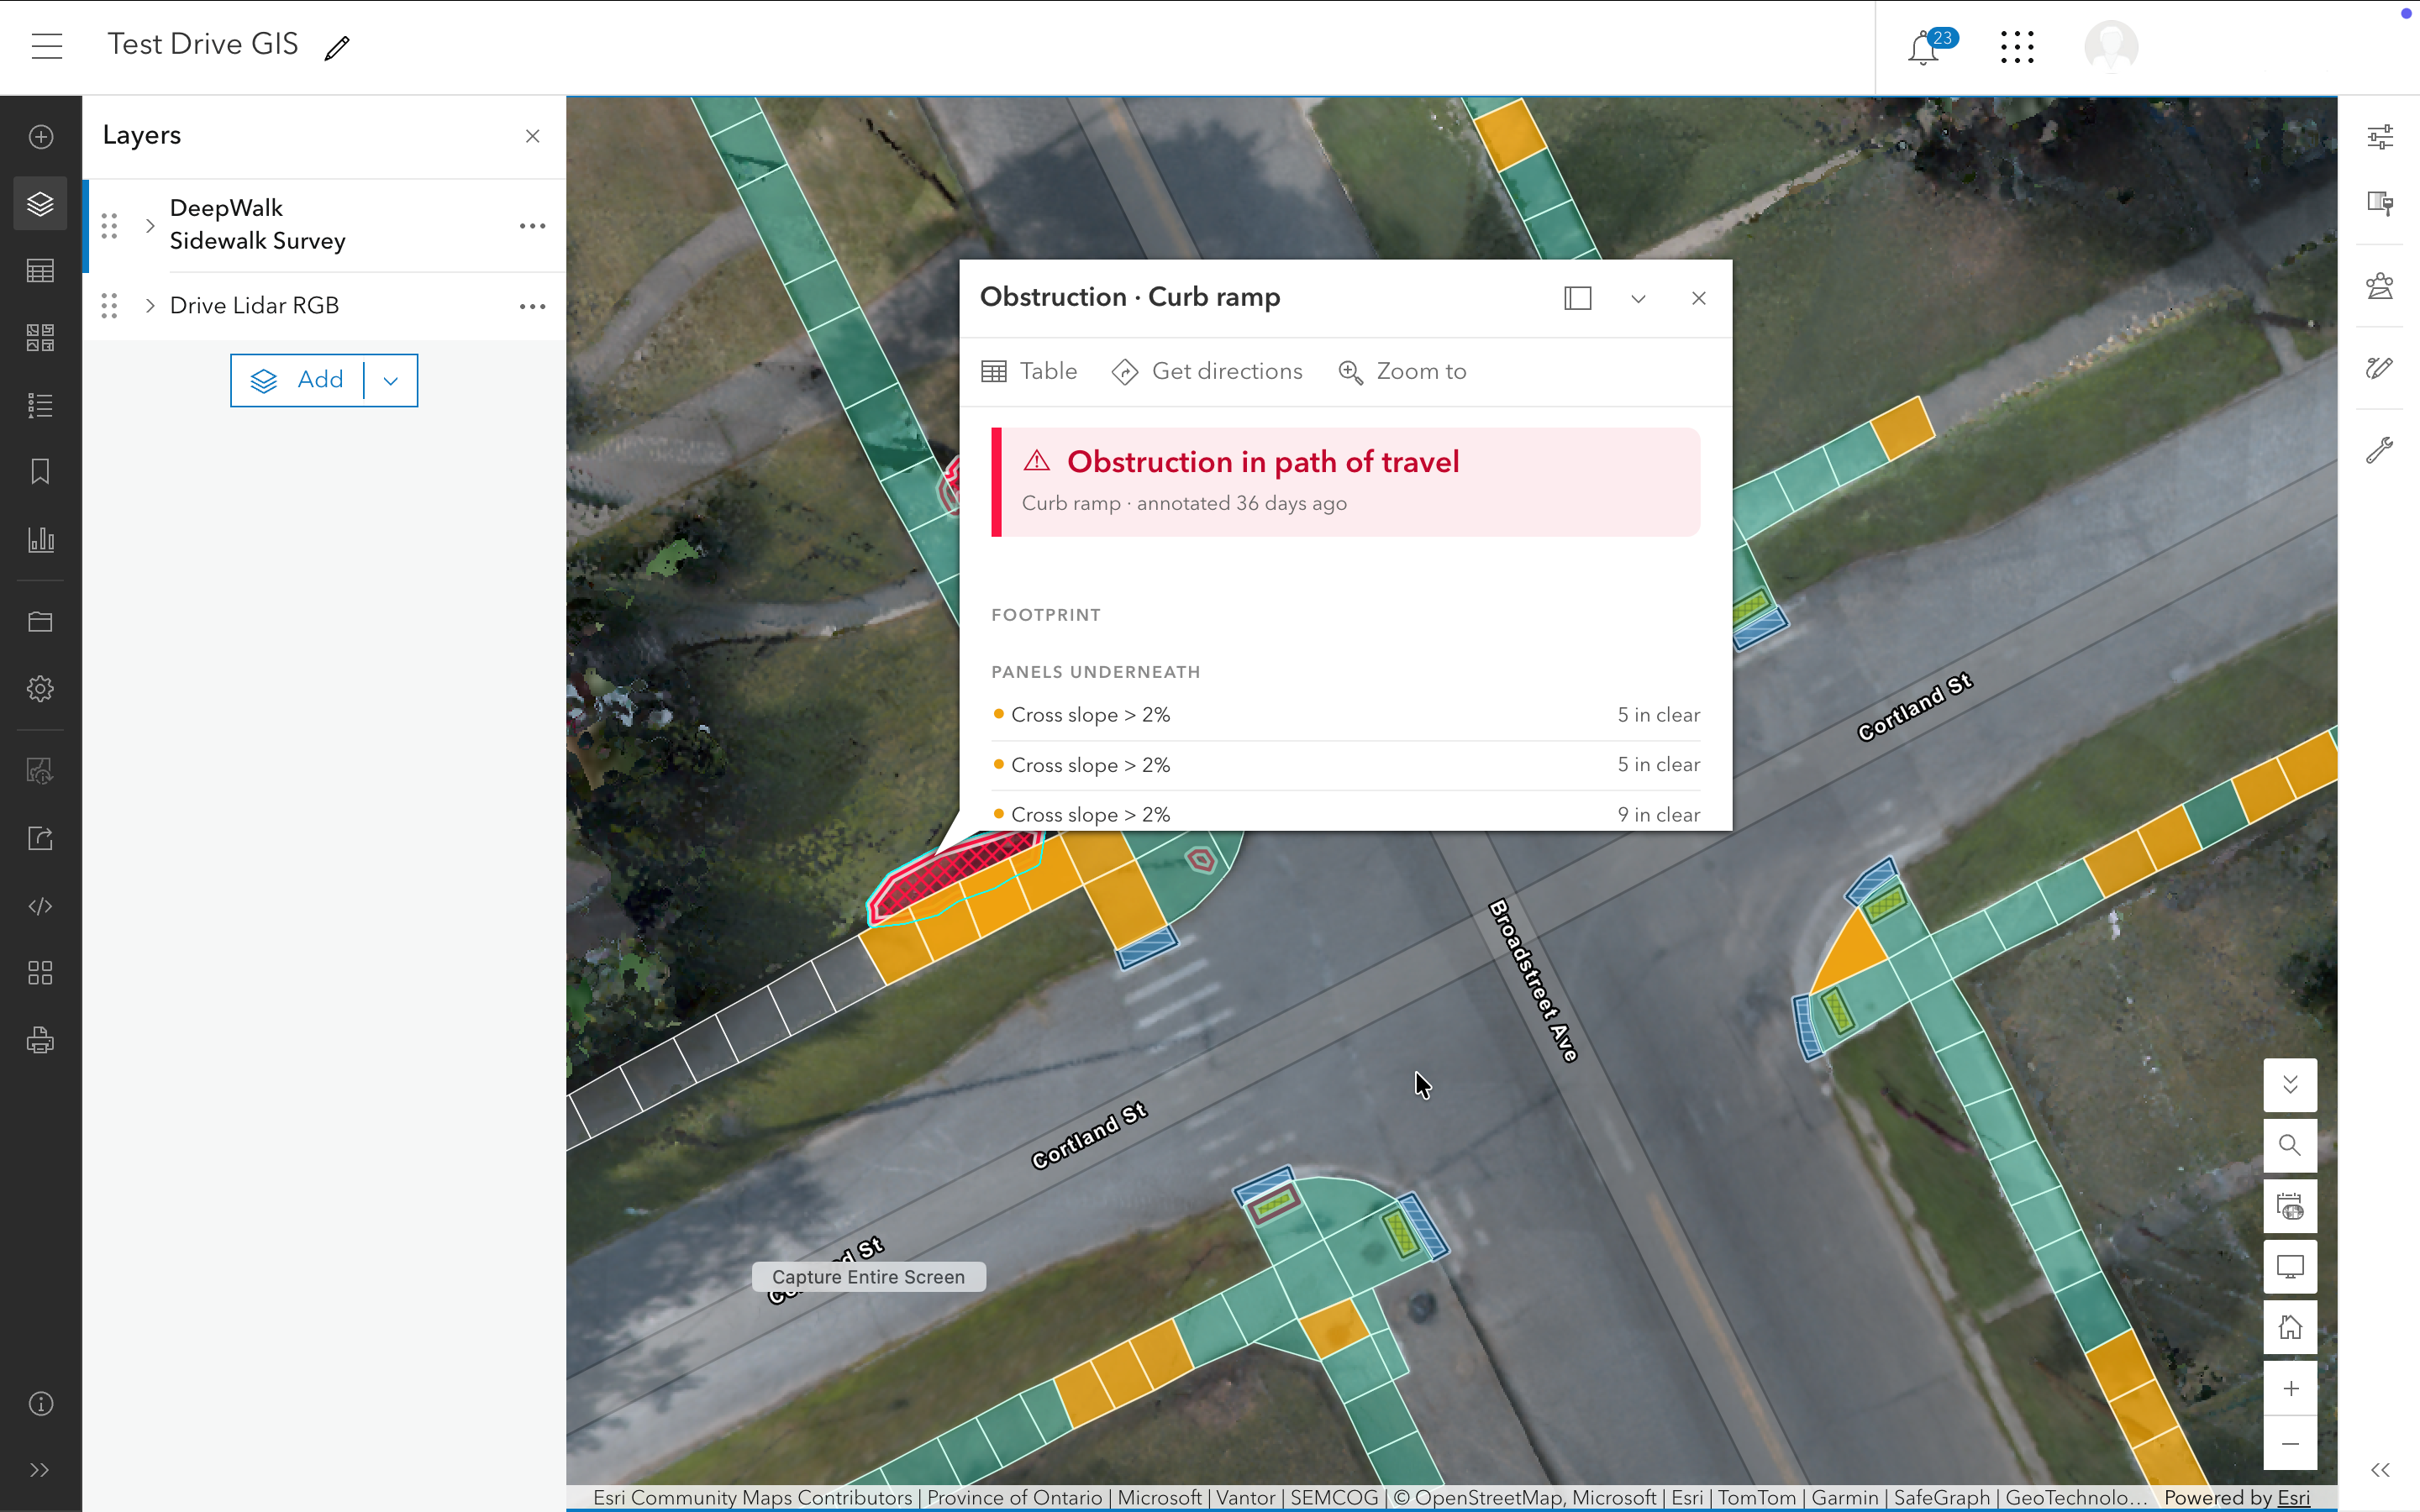
Works in the tools your team already uses
The service speaks the standard ArcGIS REST feature service protocol, so it works wherever Esri feature layers work, with no plug-ins or converters. Filter, symbolize, label, write Arcade expressions, configure pop-ups, and run statistics on it like any other layer.
Web maps and map viewer
Experience builder apps
Desktop analysis
Custom apps
Four layers, measured panel by panel
DeepWalk Drive captures sidewalks with vehicle-mounted lidar. Our reviewers draw every feature. The service publishes one layer per feature type.
Sidewalk Panels
Every individual panel with measured running slope, cross slope, and clear width, plus area, segment type (midblock or curb ramp) and annotation status
Detectable Warnings
Truncated dome surfaces at curb ramps, with depth along and width across the path of travel
Gutters
Gutter areas at curb ramps
Obstructions
Objects in the pedestrian path, mapped as polygons
Every panel is its own polygon, not one rating for a whole block, so you can find the exact panels that need work.
Measured values come from lidar. Annotated values come from the shape a reviewer drew. Every field says which.
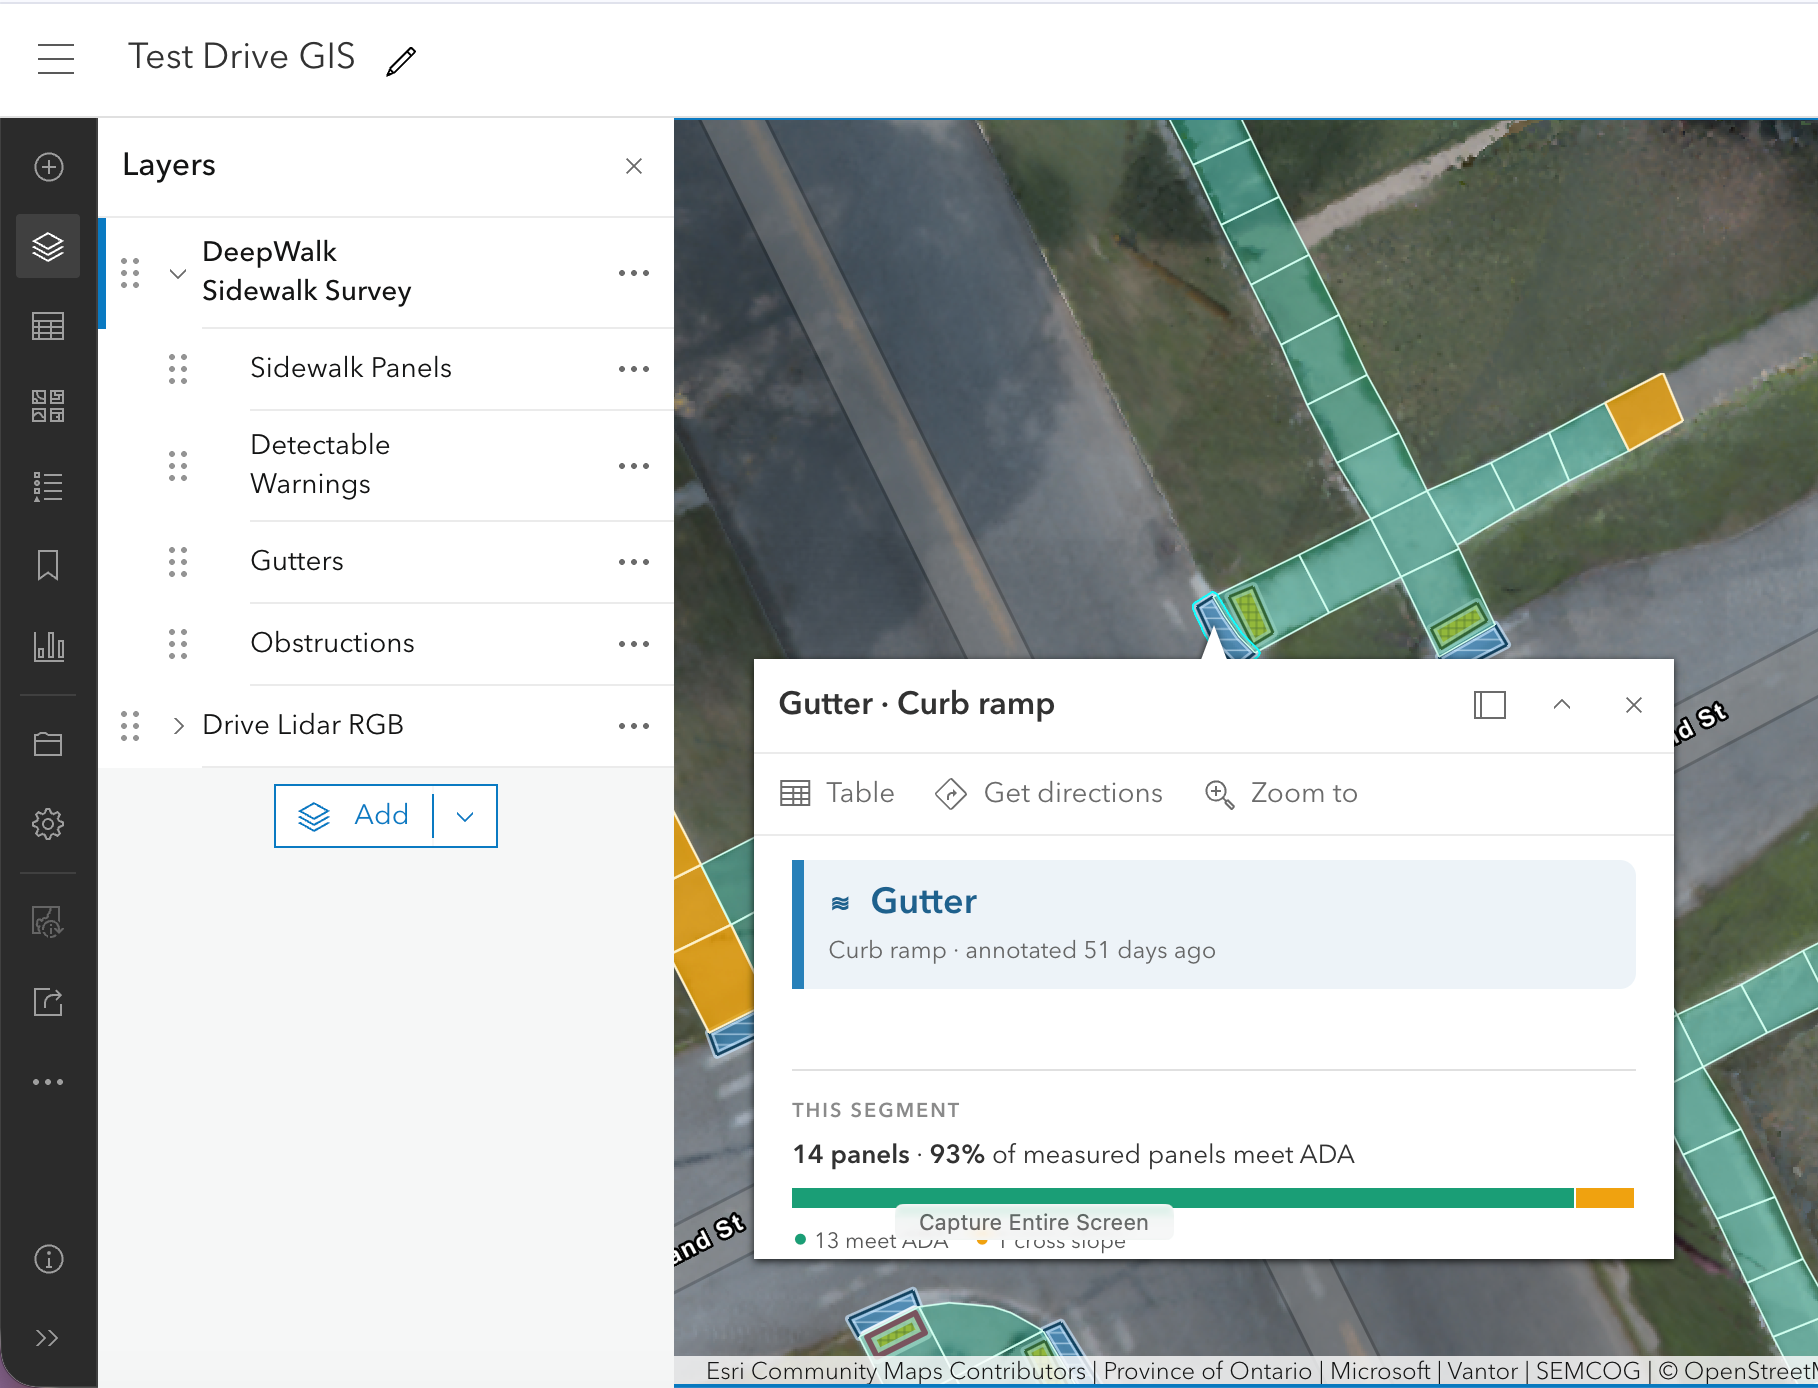
What is built on DeepWalk is live in ArcGIS
When more sidewalks are scanned, the map, the flagged-panel counts and the budget all grow with them automatically.
Flags panels whose cross slopes, run slopes, and clear widths fall outside your reference thresholds.
Turns measurements into a replacement budget. Changes a threshold or unit cost and the estimate updates by criterion, segment type, and street segment.
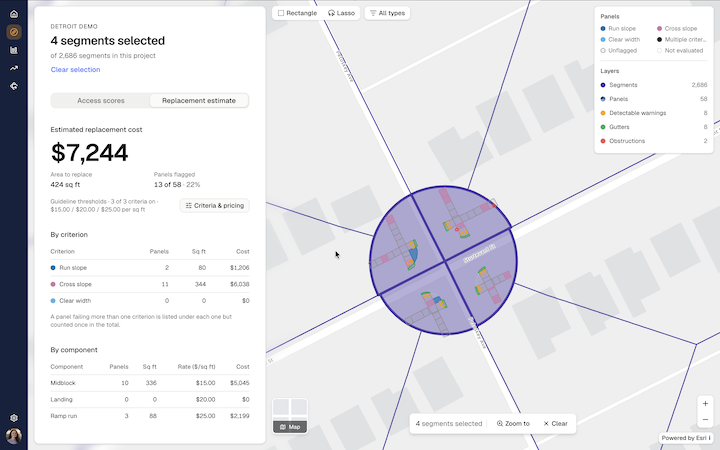
A repair cost estimate that reads directly from the live service. Unit costs shown are example values.
Connect once and stay up to date.
Request a DemoLive ArcGIS REST feature service. Every request reads current data.
4 layers: panels, detectable warnings, gutters, obstructions
Panel-level lidar assessments: running slope, cross slope, and clear width
Progress tracking through annotation status and timestamps
Works out of the box with ArcGIS Online, Enterprise, Pro, Dashboards, and the Maps SDK.
Includes DeepWalk lidar imagery as a companion tile basemap.
.avif)