Collect

DeepWalk's Collect Tools enable you to fully customize and track your data collection process.
map icon

Track data collection progress

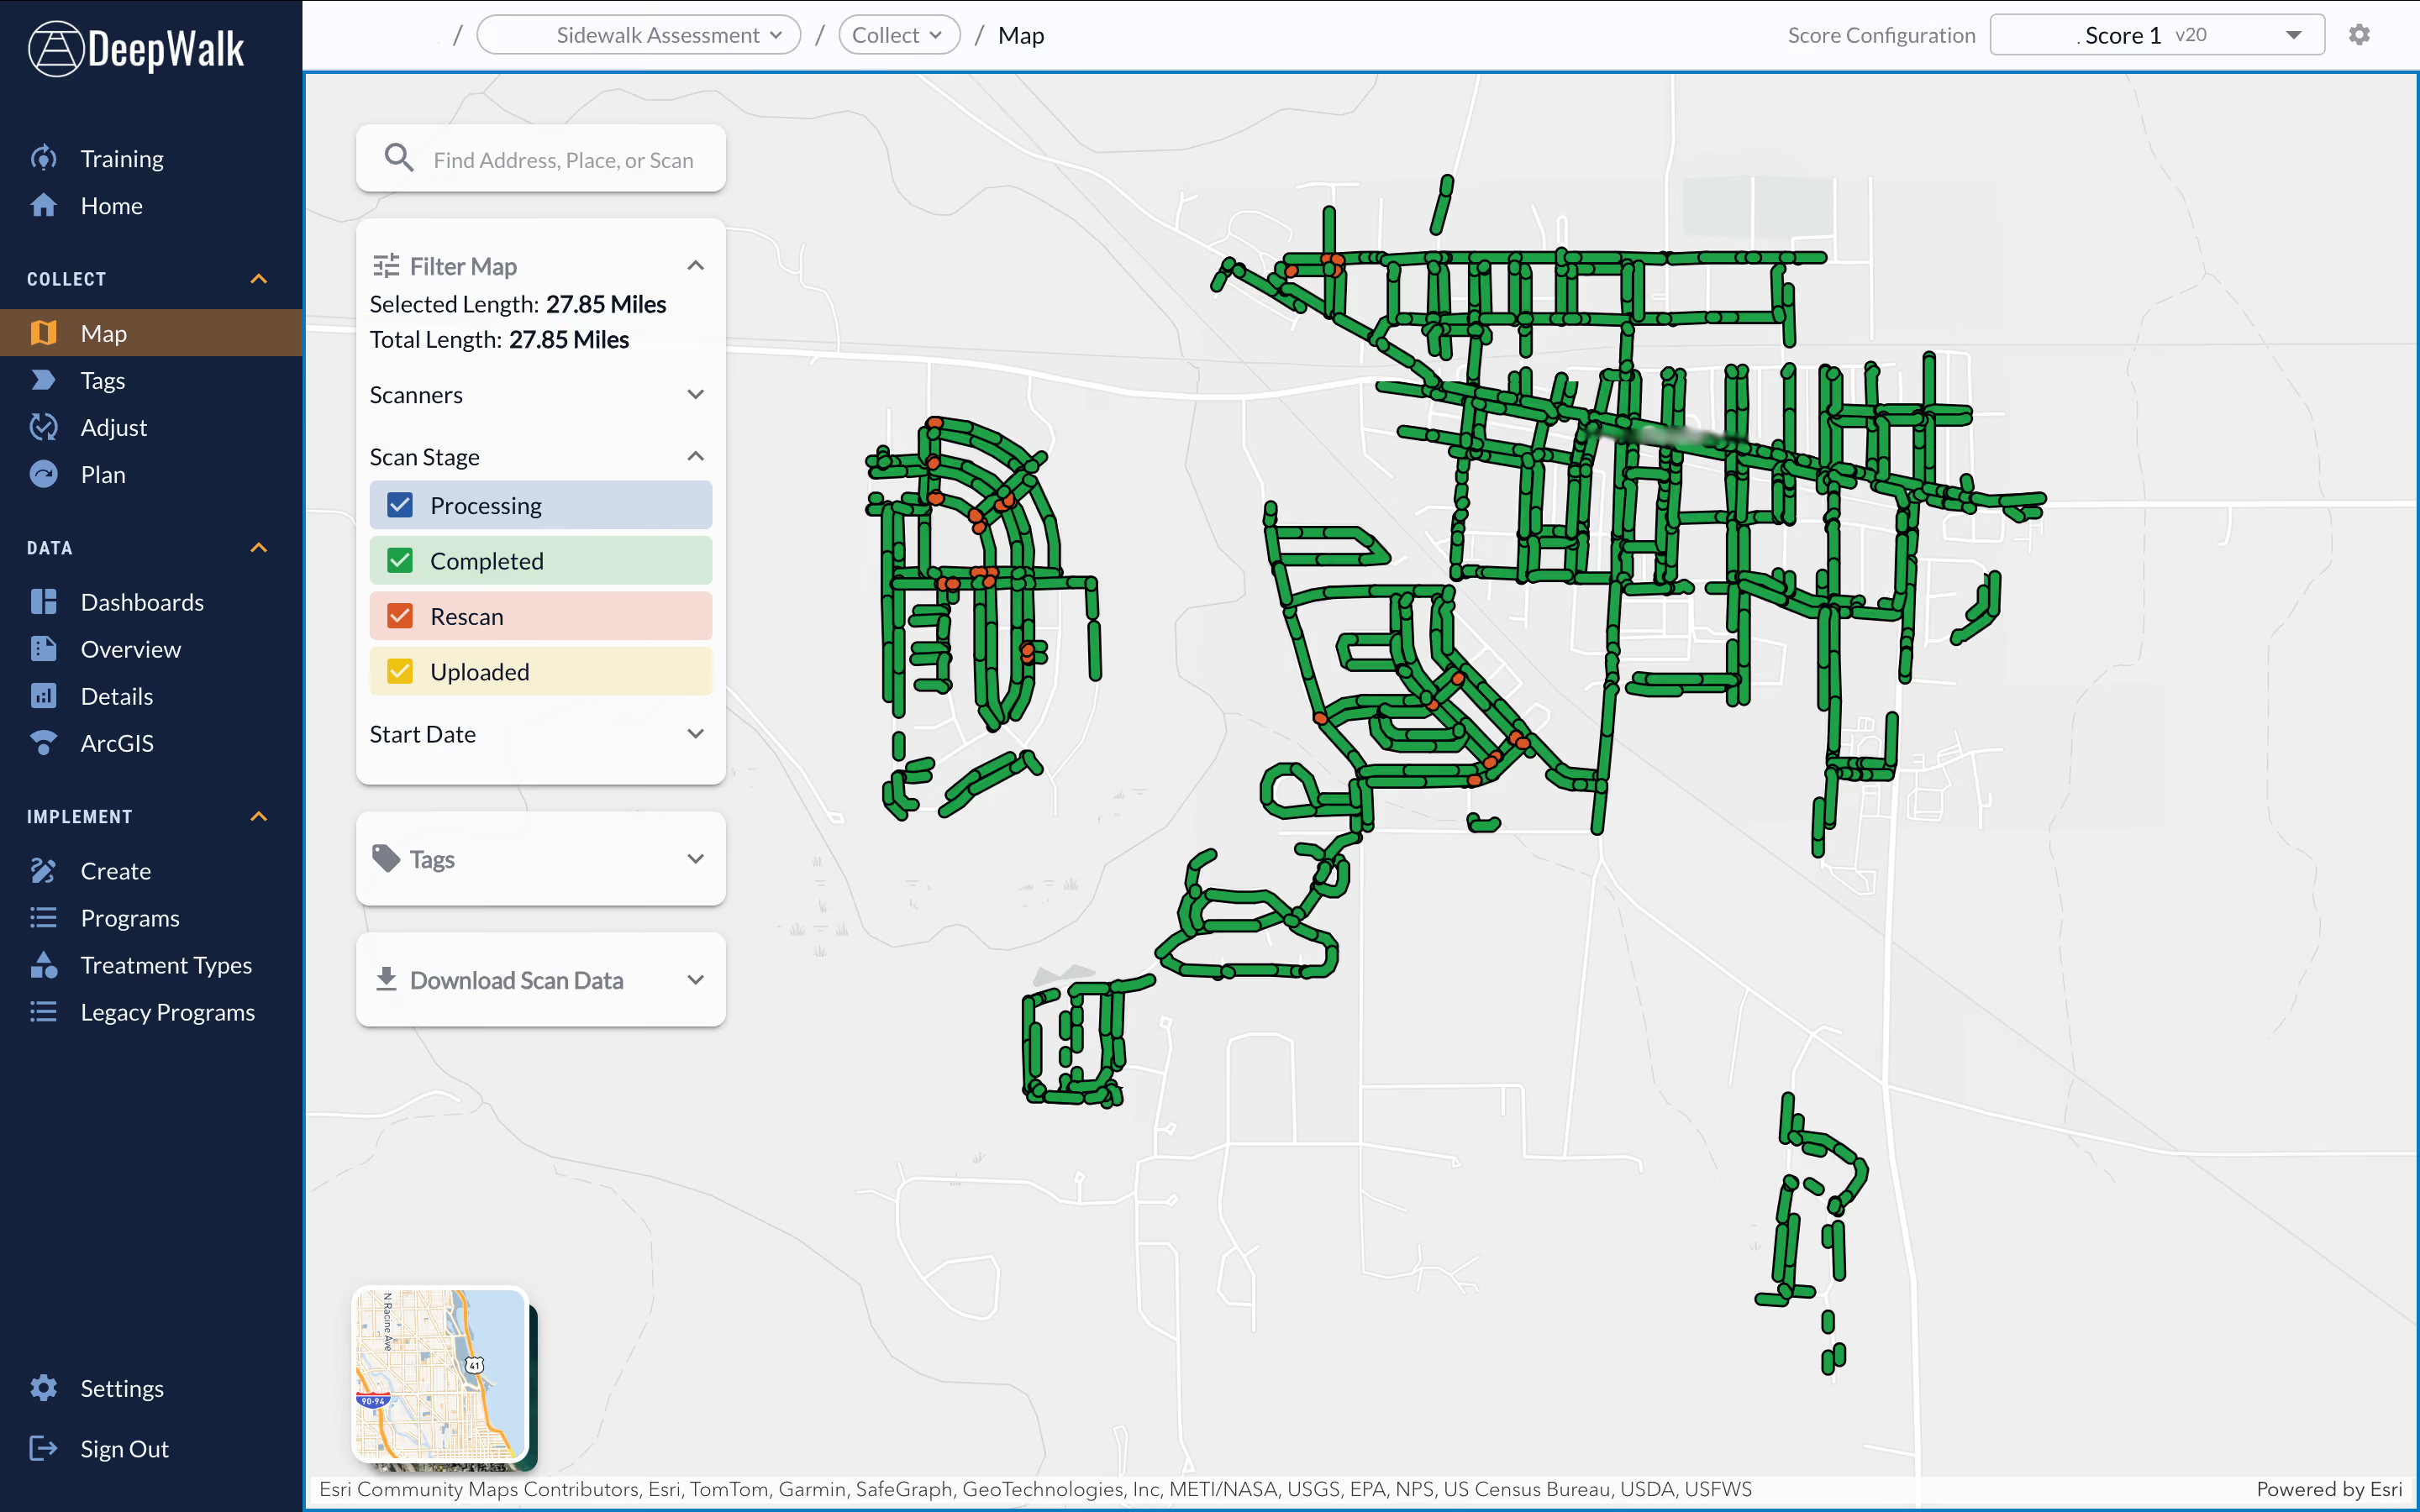
Stay up to date about the progression of your sidewalk inspection project on the collection map. Using this map, you can view scans as they are uploaded, track their movement through processing, and identify specific sidewalks are in need of rescans. This tool is key to visualizing your sidewalk system, prioritizing what is in need of collection, and ensuring data collection is moving efficiently.

Watch Getting Started: Planning Your Sidewalk Data Collection Project
Digital street map displayed on DeepWalk platform showing a network of scanned pathways marked primarily in green, indicating processing completion, with some segments in orange for rescan and yellow for uploaded status. The sidebar includes options for filtering map data by scan stage and date, and buttons for tags and downloading scan data. The map covers a total selected length of 27.85 miles.
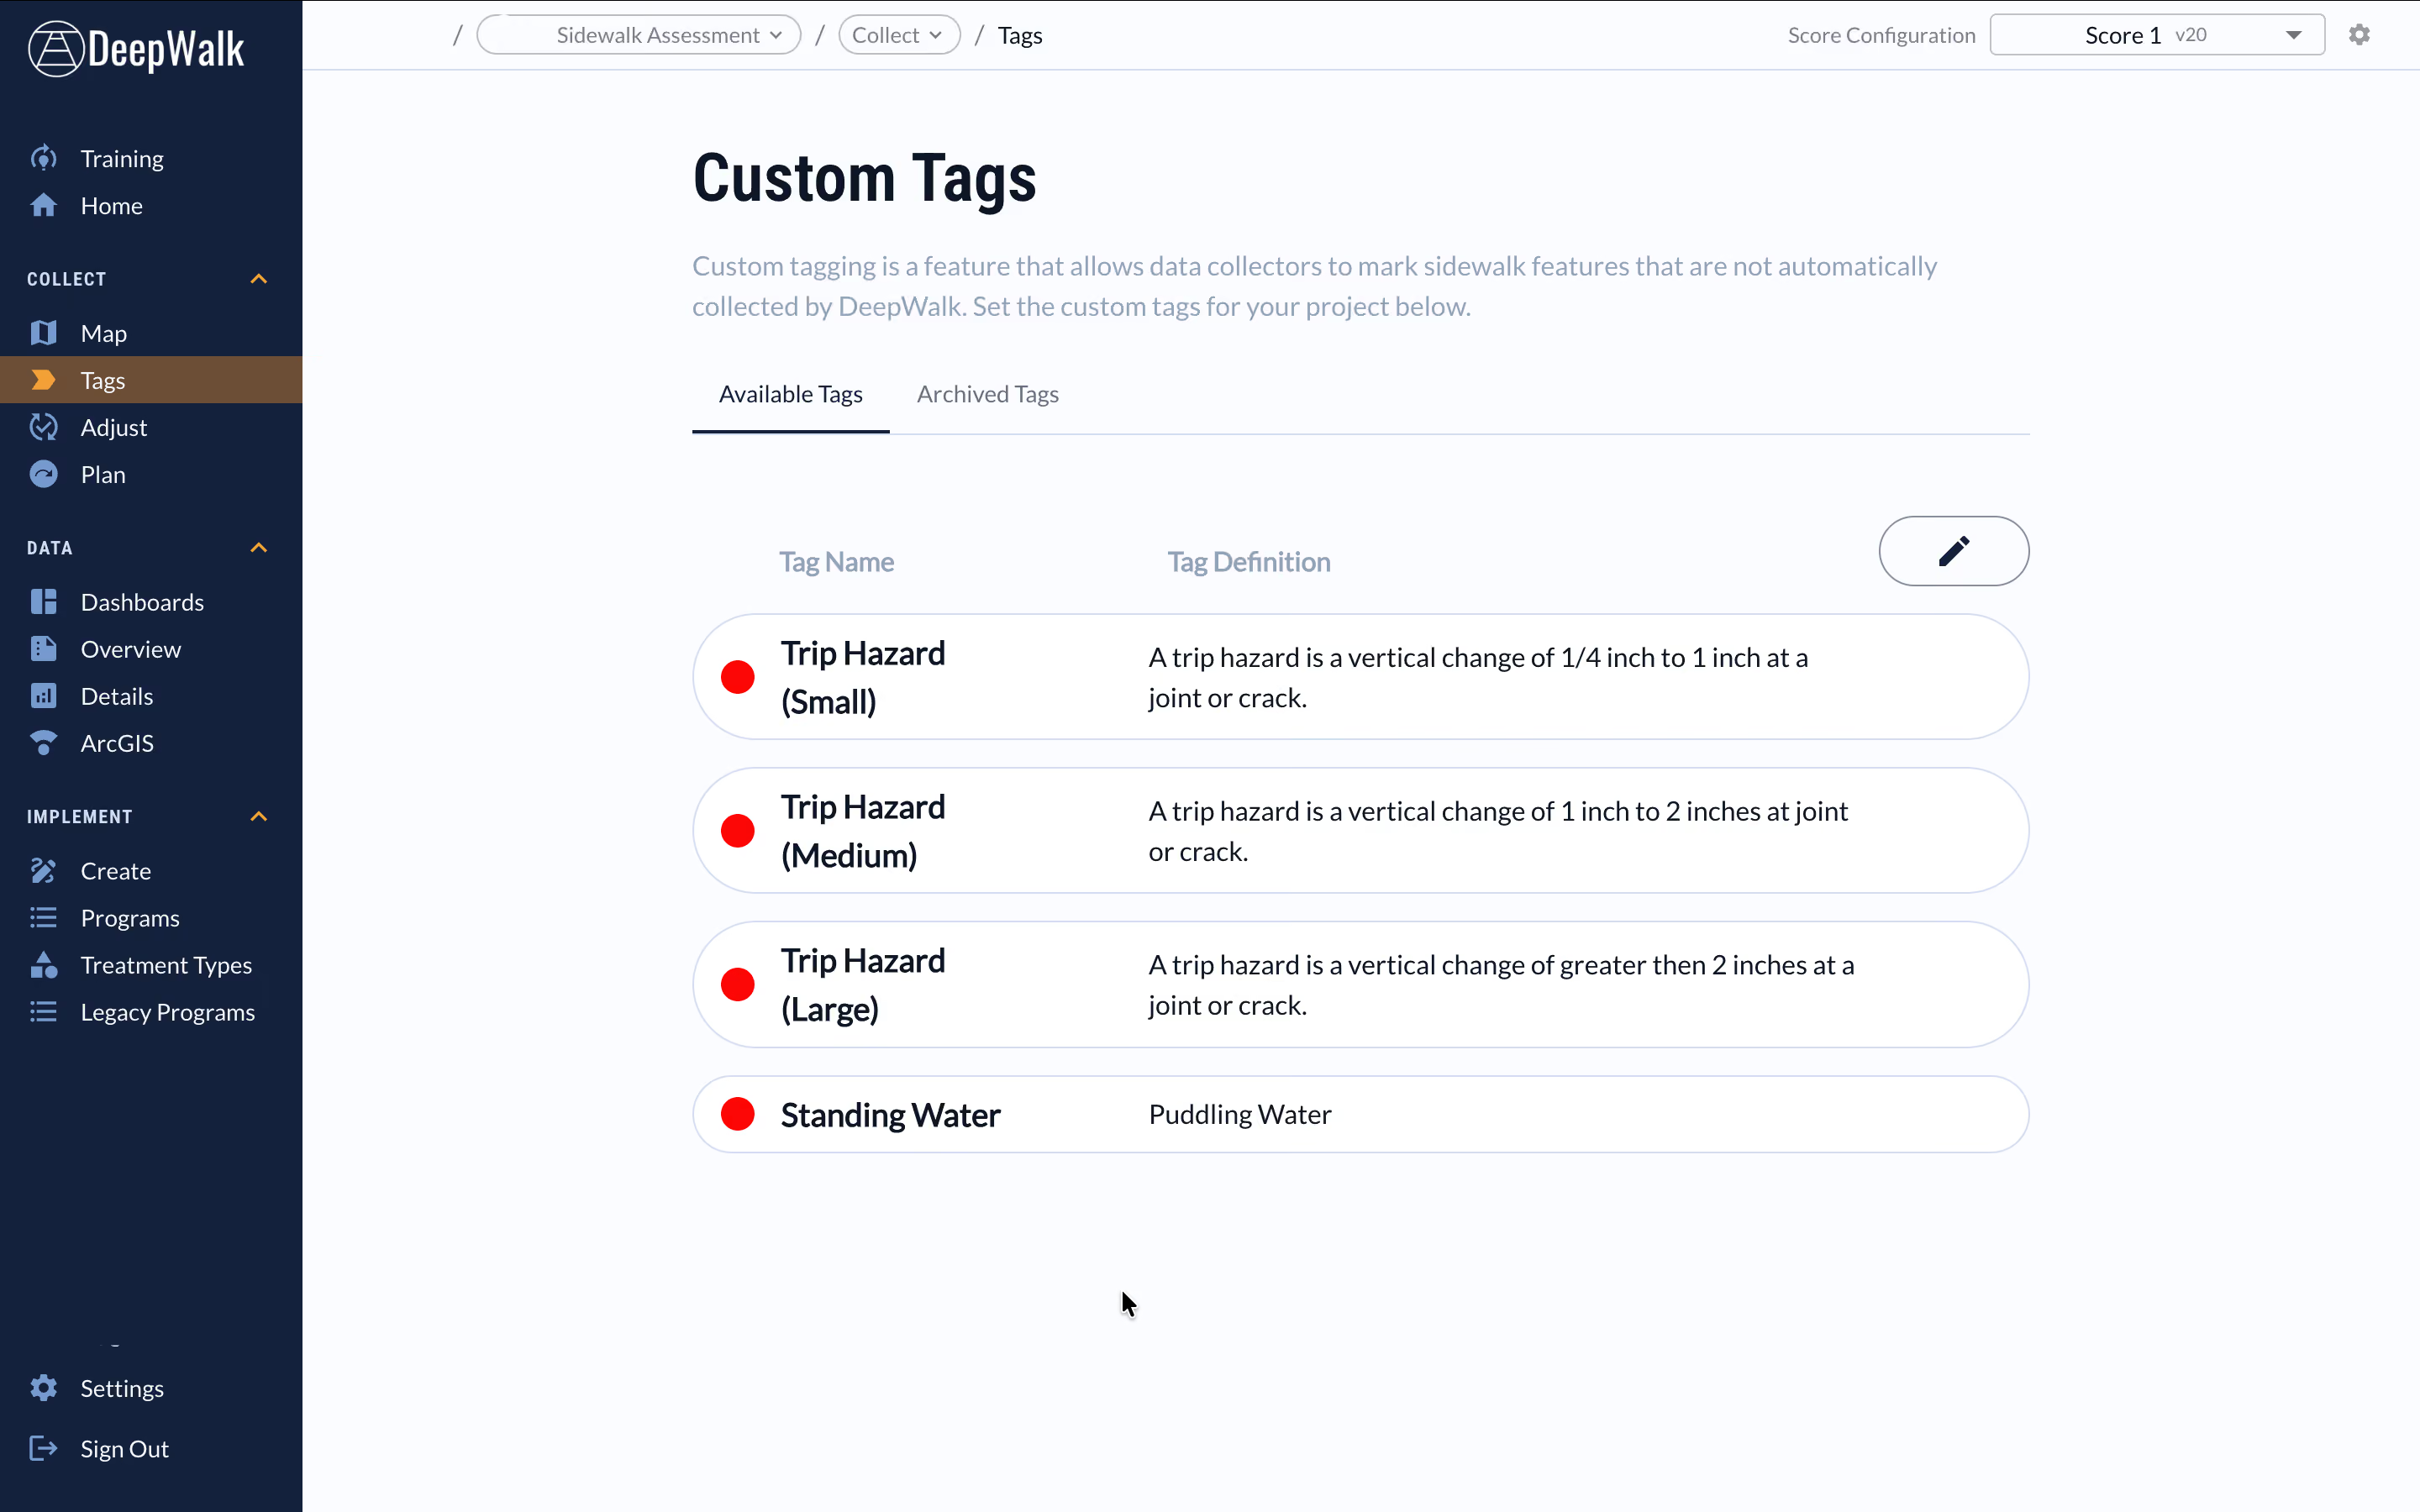
DeepWalk application screen showing a Custom Tags section with four tags listed: Trip Hazard (Small) defined as a vertical change of 1/4 to 1 inch at a joint or crack, Trip Hazard (Medium) defined as 1 to 2 inches, Trip Hazard (Large) defined as greater than 2 inches, and Standing Water defined as puddling water. The interface includes menu options on the left for Collect, Data, and Implement categories, and score configuration controls at the top.
tag arrow icon

Set custom data tags

Customize the data you collect based on your project needs. Manual tags are unique data points that are not automatically detected by our measurement system. By setting manual tags, you can collect data points specific to your project, the neighborhood, or region. Some frequently used manual tags include trip hazards, driveways, transit stops, and tree hazards.

Watch Getting Started: Planning Your Sidewalk Data Collection Project
adjust icon

Adjust sidewalk scan location

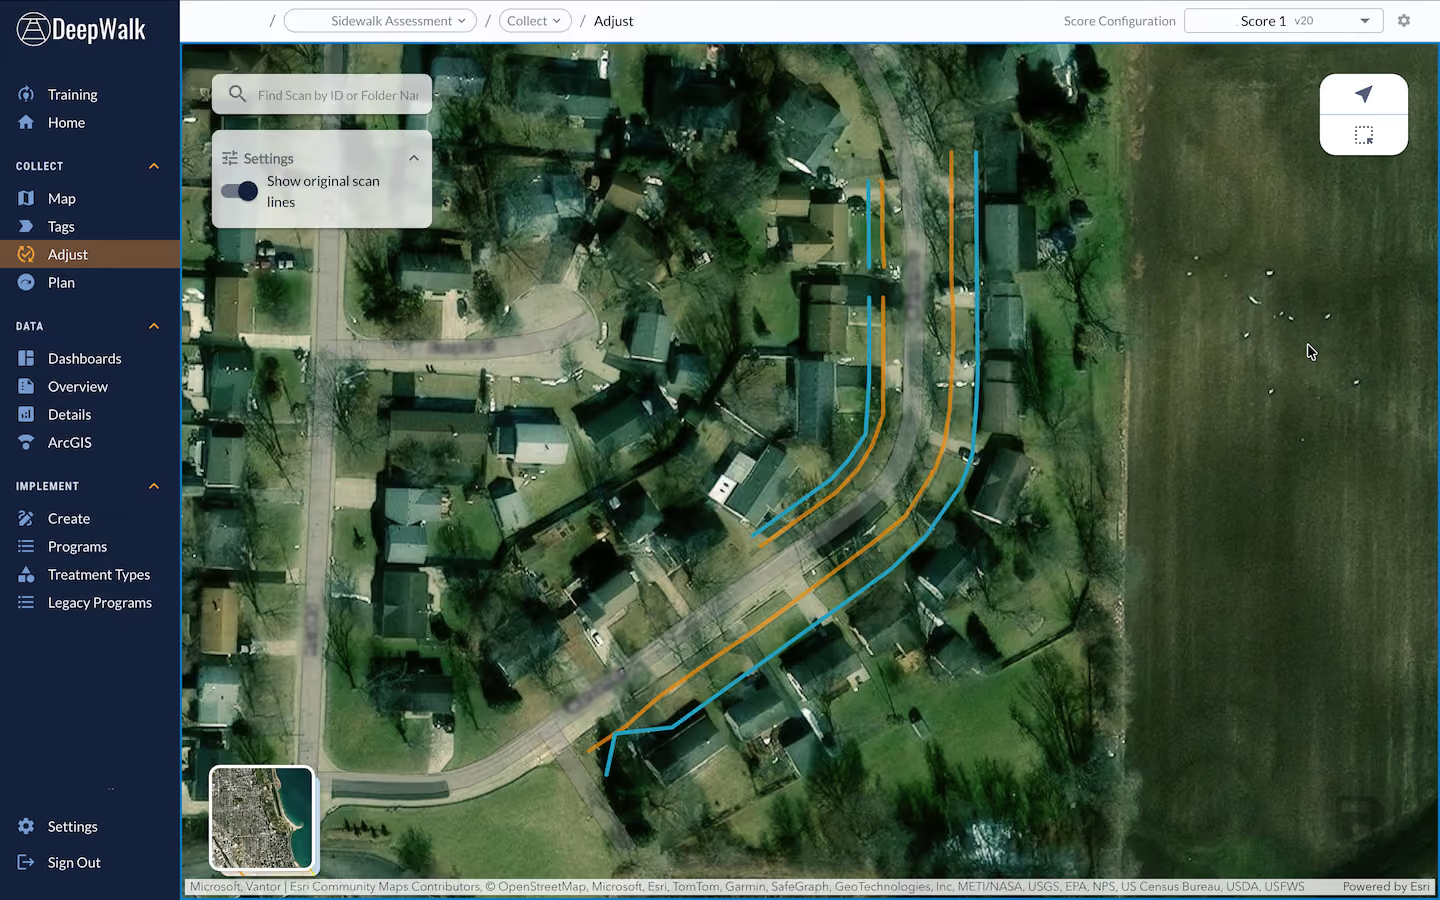
Adjust the location of a sidewalk scan if needed. Occasionally, GPS tracking gets skewed for various reasons, causing a scan location to not line up with the map. With the adjust tool, you can correct the scan location in seconds increasing location accuracy of your map layers.

Watch Getting Started: Planning Your Sidewalk Data Collection Project
Aerial satellite view of a residential neighborhood with houses and trees, showing a curved street overlaid with colored lines marking sidewalk assessments in blue and orange, displayed within the DeepWalk software interface with menu options on the left and settings panel visible.
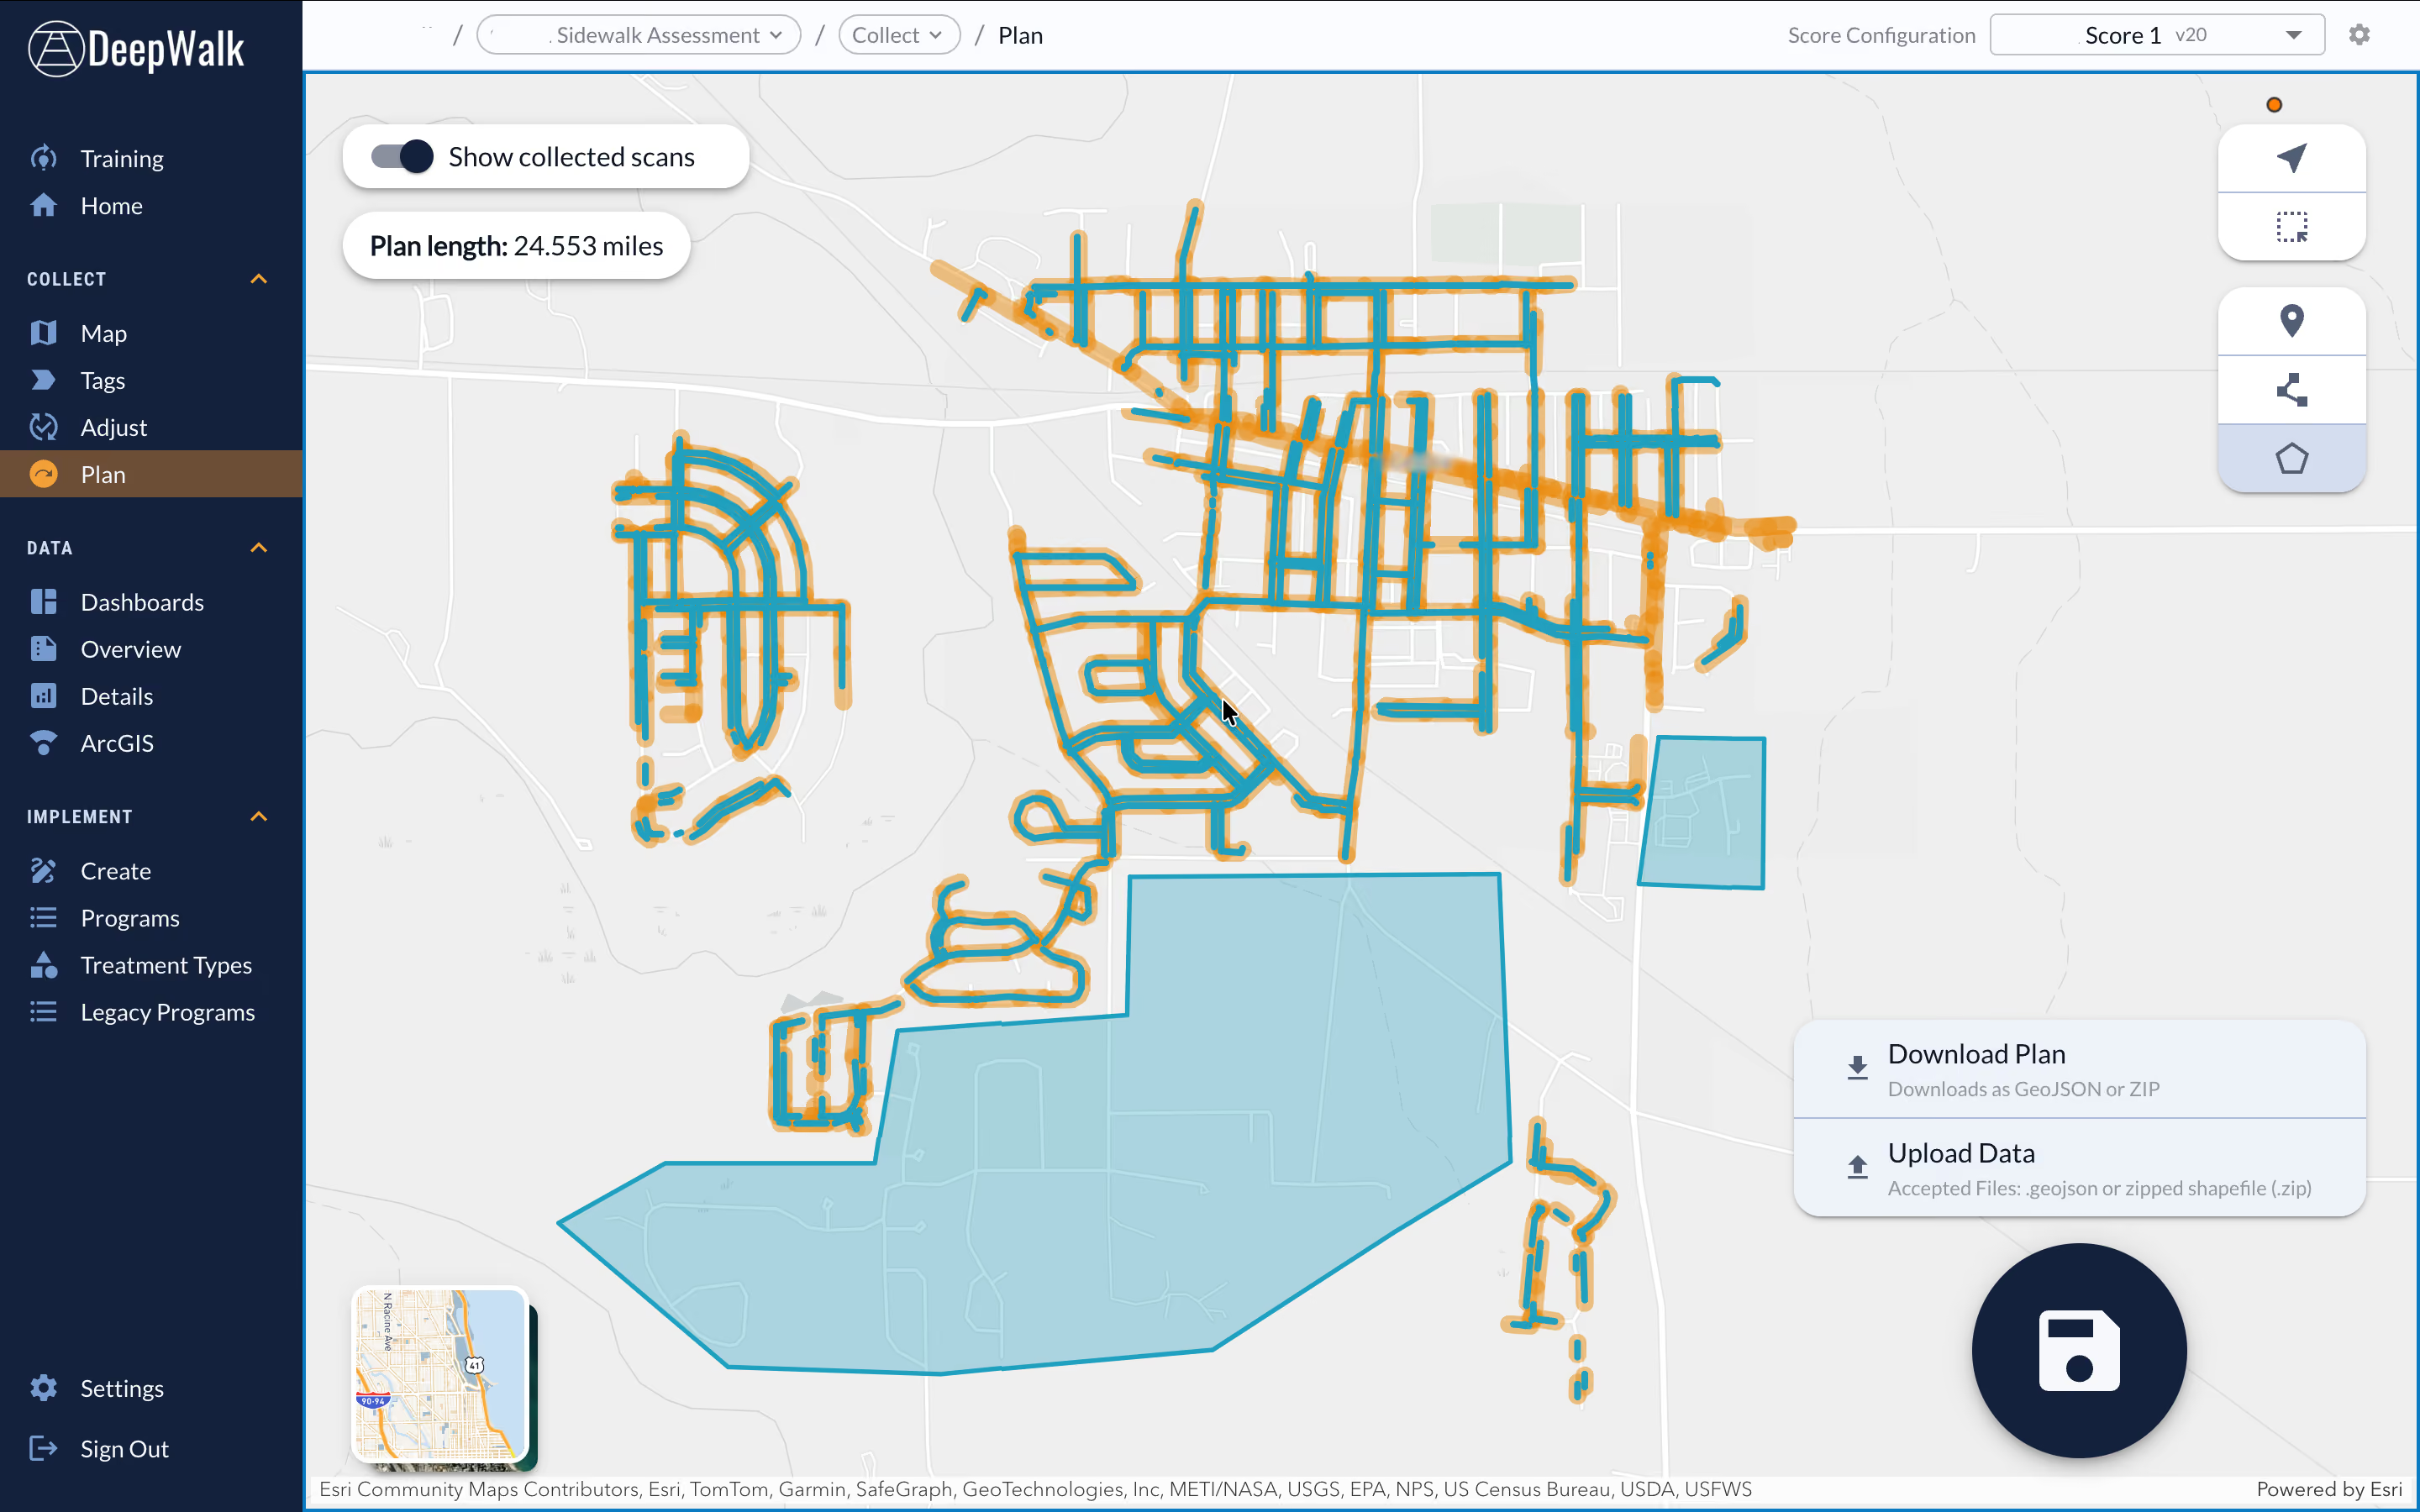
DeepWalk interface displaying a sidewalk assessment plan map with blue and orange street lines overlaid. The interface shows a plan length of 24.553 miles, navigation options on the left menu including Map, Tags, Adjust, Plan, and data sections like Dashboards, Overview, and ArcGIS. There are buttons for showing collected scans, downloading or uploading plan data, and zoom controls on the right side. A large blue polygon highlights a section of the map.
plan arrow icon

Plan data collection routes

Plan data collection routes prior to your data collection team scanning. By using this tool, you can plan a specific area, like a neighborhood or street, to be collected by your team or upload your own map files with data collection plans here as well. These plans are populated onto DeepWalk’s mobile app for data collectors to reference as they are scanning, increasing efficiency and organization during all steps of the data collection process.

Watch How To: Plan Data Collection Routes For Your Project